Experience the power of data visualization with the SandDance Data Tool Online. This innovative platform, developed by Microsoft, allows users to explore and present complex datasets through stunning 3D visualizations and smooth animations. With its intuitive interface, SandDance transforms traditional data analysis into an engaging storytelling experience, enabling you to uncover patterns, trends, and insights effortlessly.
Whether you’re a data analyst or a casual user, SandDance offers a variety of chart types and advanced filtering options to tailor your visualizations to your specific needs. Its open-source nature provides flexibility for customization, making it a versatile addition to any analytical toolkit. Dive into your data like never before and let SandDance help you visualize your insights in a captivating way.
Best Free Online SandDance Data Tool
Also See: Query Csv With Sql Online, Text Extractor For Web Pages and Text, URL Extractor For Web Pages and Text
Information about the Tool: “SandDance Data Tool”
The “SandDance Data Tool” is an interactive and visually engaging utility that enables users to explore and visualize their data using the powerful SandDance library. This tool is designed for users who wish to gain deeper insights into their data with dynamic and customizable visualizations.
What is SandDance?
SandDance is a data visualization library developed by Microsoft. It allows users to explore data in a highly interactive way, providing animated transitions between different visualization styles such as scatterplots, histograms, bar charts, and more.
Use Cases:
- Data Analysis: Quickly identify trends, patterns, and anomalies in datasets.
- Presentations: Create visually appealing and interactive data visualizations.
- Educational Purposes: Teach concepts related to data exploration and visualization.
- Business Insights: Analyze large datasets to make informed business decisions.
Key Features of the Tool
Flexible Input Options:
- Accepts CSV file uploads for easy data input.
- Parses datasets with various structures and sizes.
Dynamic Visualization:
- Supports multiple visualization types (scatterplots, bar charts, histograms, and more).
- Interactive filtering and grouping for deeper data exploration.
- Smooth transitions between visual styles.
Customizable Views:
- Allows users to manipulate axes, color schemes, and dimensions.
- Provides options to highlight or focus on specific data subsets.
Secure and Client-Side:
- Processes data locally within the browser.
- Ensures user data remains private and secure.
How to Use the Tool
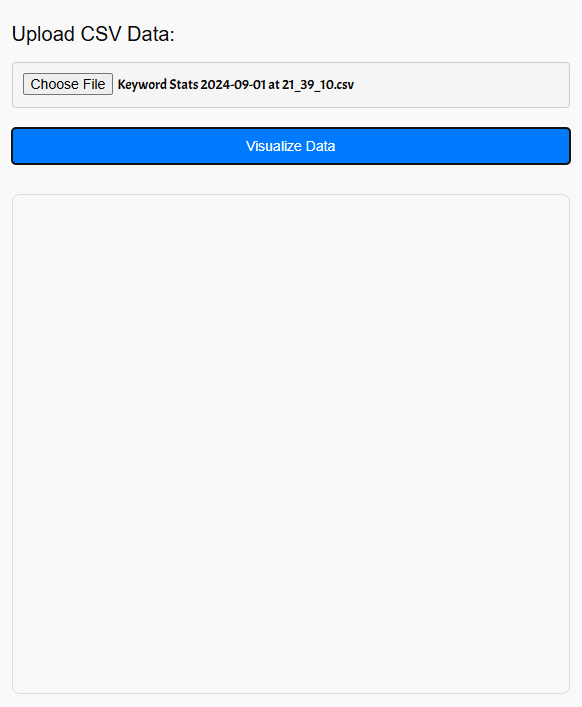
- Upload CSV Data:
- Click the “Upload CSV” button and select your data file.
- Visualize the Data:
- The SandDance viewer automatically loads and displays the data in an interactive visualization.
- Use the controls to switch between chart types and customize the view.
- Explore and Analyze:
- Filter, group, and manipulate data to discover insights.
- Use animations to understand transitions between visual states.
Example
For CSV Input:
Product,Category,Sales,Region
Laptop,Electronics,1200,North America
Tablet,Electronics,800,Europe
Desk,Furniture,300,Asia
Chair,Furniture,150,South America
Generated Visualizations:
- Bar chart showing sales by category.
- Scatterplot highlighting sales distribution by region.
- Histogram displaying sales frequency.
Benefits of the Tool
- User-Friendly: Intuitive interface for seamless data visualization.
- Efficient: Instantly transforms raw data into meaningful visual insights.
- Versatile: Suitable for diverse datasets and use cases.
- Interactive: Engages users with dynamic and customizable visual elements.
- Private: Processes data locally to ensure user privacy.
This tool is ideal for data scientists, analysts, educators, and anyone looking to transform data into actionable insights. If you have additional feature requests or custom requirements, feel free to share!
(FAQ) about SandDance Data Tool Online
1. What is SandDance?
SandDance is an open-source data visualization tool developed by Microsoft Research that allows users to explore and present their data through interactive visualizations. It helps identify patterns, trends, and insights in datasets by providing various chart types and 3D visualizations.
2. How do I access SandDance?
You can access SandDance online through its dedicated web application, or as an extension in platforms like Visual Studio Code, Azure Data Studio, and Power BI. Simply install the extension from the respective marketplace to get started.
3. What types of visualizations does SandDance offer?
SandDance provides a range of visualization options, including scatter plots, bar charts, and 3D visualizations. It even includes a recommender feature that suggests the most suitable chart type based on your data.
4. Can I customize my visualizations in SandDance?
Yes, SandDance allows for extensive customization. Users can adjust chart types, colors, and data mappings to tailor their visualizations according to specific needs or preferences.
5. Is there a way to save my visualizations?
Absolutely! SandDance offers a snapshot feature that lets you save your current visualization state. You can add notes to these snapshots and share them as JSON files or convert them to Markdown or HTML formats.
6. Is SandDance suitable for beginners?
Yes, SandDance is designed with user-friendliness in mind, making it accessible for both beginners and experienced data analysts. Its intuitive interface simplifies the process of data exploration and visualization.
7. What types of data can I visualize with SandDance?
You can visualize various types of data formats, including CSV files and databases. Simply upload your dataset into the tool to start creating visual representations.
8. Is SandDance free to use?
Yes, SandDance is completely free to use as it is an open-source project. You can download it and utilize its features without any cost.
2 thoughts on “SandDance Data Tool Online”